Useful Indicators
Before I begin this week’s post, I can’t help commenting on the weather we’ve been having these past several days. As I wrote this yesterday morning the sky was dark, rumbly, and ominous. And the sights and sounds during the wee hours of Sunday were truly phenomenal.
Like many, our family was woken around 4am by thunder and a tremendous crack of lightning that caused a fire across the street from our home. Fortunately, the rain came and the wind died at the perfect time to help neighbors extinguish the small blaze. If nothing else, this unpredictable weather shows that anything can and will happen. Anxious and exciting times indeed!
Much the same can be said for our economy as it emerges from recession. We are all aware that the recovery so far has been uneven with some sectors doing much better than others. In many ways this reflects the rapid adoption of technology that we had been on the path to adopting anyway. Two obvious examples are the shift to virtual instead of in person meetings and the Amazonification of retail. Both offer long-term opportunity for our economy but lead to messy unintended consequences in the near-term.
There are a variety of indicators to gauge how all of this is playing out in the real economy. Today we’ll look at two. I’ve previously mentioned the high quality and prolific work done by Bespoke Investment Group and wanted to share some of their insights with you. I’m going to italicize their work below so you can tell who’s who.
The first indicator we’ll look at is air travel. The TSA reports how many passengers it processes through security each week. These numbers, like gasoline sales and freight traffic on the highways, gives us an idea of how the wheels of commerce are turning. In other words, if folks aren’t flying, they’re not doing business, spending money on vacation, and so forth. Yes, there’s Zoom, but not everything can be done virtually so actual travel is still vital to the health of the economy. We know that air travel dropped off a cliff following shelter-in-place orders in March. Let’s review where we are now.
According to Bespoke… there aren't many scenarios where a 67% year/year decline in any measure of activity is considered a good thing, but when it comes just four months after that same measure was at negative 96%, you can understand if people in that industry start to get a little bit excited. The chart below shows the seven-day average change in passenger throughput as measured by the TSA. Through Sunday, the seven-day average [was] 715,777 passengers compared to an average of 2.465 million passengers in the comparable seven days last year. While traffic is down 67% compared to last year, it was still the least negative reading for the seven-day average since 3/22, just days after the WHO declared COVID a pandemic in March.
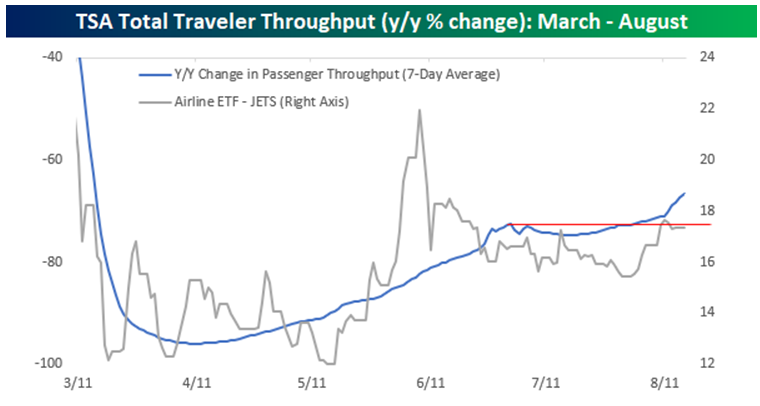
So, TSA passenger volumes have been slowly moving in the right direction even in the face of travel restrictions and a general unease about being locked in a steel tube with other people amid a global pandemic. All kidding aside, this increase in passenger volumes is good to see, we just need to see more. A lot more.
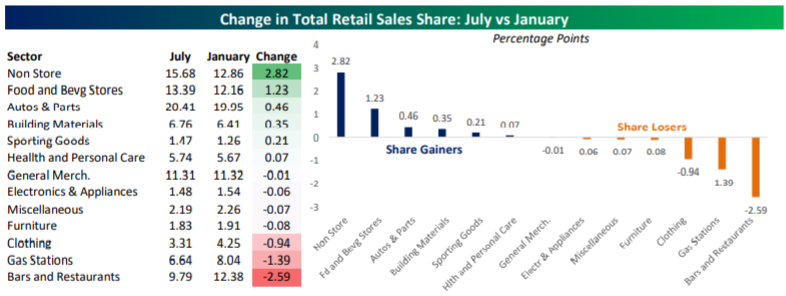
Another indicator is the detail within the widely reported retail sales numbers. The following chart and commentary from Bespoke shows how we’ve bounced off the lows of March and April, likely helped a great deal by Congressional stimulus. But we still have a way to go before we get back to normal in terms of what Americans are spending. Here's look at what folks are actually buying and how this has changed in the Covid era.
The table and chart below show how each sector’s total share of Retail Sales has changed between January and July. Online sales, which were already in a secular growth mode, only saw that growth accelerate with the sector now accounting for nearly 16% of all sales. With a large number of Americans still fearful of leaving their homes, it only makes sense that they would be shifting their spending to online providers… Covid has only accelerated what will ultimately be the dominance of online retail over brick and mortar peers… The next largest gainer in share has been Food and Beverage Stores, which have seen their increased share of sales come at the expense of Bars and Restaurants, many of which remain closed or at best serving limited capacity. Consumers are also going out less, and that means less driving and getting dressed up. That’s not good for Gas Stations or Clothing Retailers.
These indicators show us what we already intuitively know. The lives and habits of many Americans have shifted in recent months and each shift has a variety of corresponding economic impacts. Also, our situation is improving in the aggregate at the expense of specific parts of our economy. More stimulus from Congress will help keep these numbers moving in the right direction and assumptions about that are what, at least in large part, is driving stock prices higher. I’ll continue watching these and other indicators to see how all of this plays out in the coming weeks and months.
Have questions? Ask me. I can help.
- Created on .


