Black Monday Remembered
Black Monday, October 19th, 1987, is a stock market event that’s long been an example of how fast things can go wrong when investors behave badly. There were a variety of reasons, structural and otherwise, for why it happened the way it did, but the bottom line is that investors really freaked out and selling begat more selling.
The anniversary yesterday seems especially poignant as we’ve seen so much uncertainty and volatility this year. Many investors simply panicked back in March and have felt left behind in recent months as markets rallied. Others who didn’t panic felt a sense of relief at how things have played out so far. But now many see risk rising again as our economic recovery slows and we edge closer to the election. No rest for the weary, right?
I think days like Black Monday are important to remember, either from personal experience or by study, because they lend perspective about what it takes to be a long-term investor. As the old saying goes: If it were easy everybody would do it. During a (hopefully) long investment horizon there will be lots of bad days mixed in with the good days, but it’s the slow build of value over time that truly matters. And the slow build can still happen, even if you feel like you’re working yourself out of a hole.
To illustrate this point let’s look at a brief research note about Black Monday from my partners at Bespoke Investment Group. They touch on how bad the market environment was at the time and how, in the decades and all the market events since, stocks and bonds still generated good returns for long-term investors, even if their timing was horrible. This will be helpful to remind ourselves of in the coming months.
Continue reading…
Thirty-three years ago [yesterday], US equity markets experienced their worst single day decline on record as the S&P 500 fell 20.5% while the Dow dropped over 22%. If you were alive or old enough to remember things at the time, you remember the 1987 crash. In the case of the Dow, it wasn't the worst single-day decline on record as the index dropped more than 23% on 12/12/1914, but the caveat here is that the 1914 decline came after a nearly five-month stretch where the stock market was closed due to World War I. In 1987, the only closure the crash followed was a two-day weekend.
While the crash of 1987 surprised most investors, it wasn't as though the weakness came out of the blue. In the two months leading up to the crash, the S&P 500 was already under significant pressure leading up to that day. For example, from the closing high on 8/25/1987 through the close on the Friday before the crash, the S&P 500 was already down over 16%.
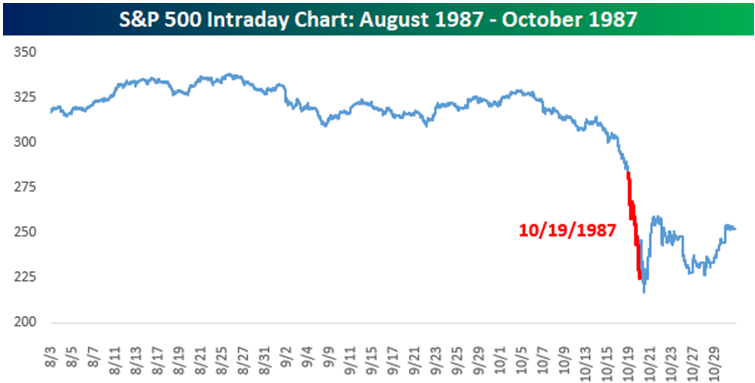
With the market already down 16% heading into the Monday crash, you wouldn't have faulted an investor for thinking the sell-off was overdone and putting some money to work right before. As the saying goes, buy low and sell high, right? While that approach may have sounded good in theory, in practice it was a disaster. It didn't take long before that initial investment was already down over 20%, putting the investor in what would have seemed like an insurmountable hole.
Picking up a copy of the New York Times on 10/20/1987 would have only reinforced that sentiment. While they are more frequent now, headlines that spanned the entire front page used to be extremely rare, but the day after the crash, that's exactly what we saw, including one headline which read "Does 1987 Equal 1929?" Given the sheer size of the decline and the headlines, you couldn't have faulted an investor for cutting their losses and moving on.
While the New York Times deemed the crash of 1987 as an event worthy of the entire front page, the Wall Street Journal took a more reserved approach dedicating just two columns to its main headline, and explaining that in reference to the question "A Repeat of '29?" that a "Depression in '87 Is Not Expected."
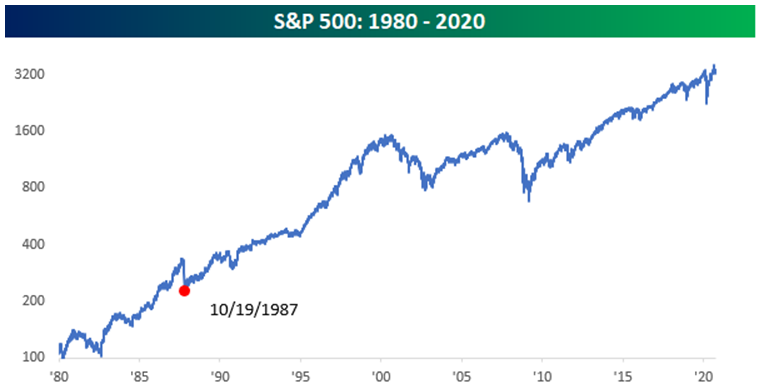
With the benefit of hindsight, while you may not have faulted an investor for cutting their losses the day after the crash, it was entirely the WRONG move as Black Monday essentially marked the low of that bear market. The '87 crash obviously looked disastrous on a short-term intraday chart of the S&P 500 from 1987, but from a longer-term perspective, it looks a lot less intimidating. The chart below shows the S&P 500 on a log-scale going back to 1987, and from this perspective, the 1987 crash now looks like a minor blip.
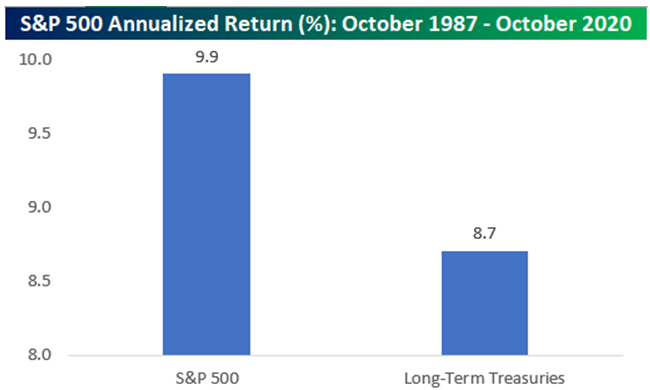
To further illustrate this point, let's take the theoretical example of the person who plowed some money into the stock market on the day before the crash. From a timing perspective, it couldn't have been worse. With the benefit of time, though, an investor who held on for the ride actually fared pretty well even outperforming long-term Treasuries. As shown in the chart below, the S&P 500's annualized total return from the Friday before the '87 crash through this past Friday works out to just under 10% at 9.9%. Long-term US Treasuries have also performed well over the same time period, but with an annualized gain of 8.7%, they've underperformed the S&P 500.
The lesson here is clear: even the worst-timed trade ever worked out in the long-term. Panic selling after steep market drops throughout history has been the wrong move 100% of the time if your time frame is long enough.
Have questions? Ask me. I can help.
- Created on .


