Good News?
The rough patch for stocks deepened last week with the S&P 500 posting its seventh weekly loss in a row and almost touching bear market territory (a 20% loss from a recent high). Parts of the index, such as Consumer Discretionary and Technology sectors, are already there. In fact, the only two positive sectors so far this year through last Friday are Utilities and Energy, up about 1% and almost 49%, respectively. Otherwise, the next best (or least bad, depending on your mood) sectors are still down around 8% this year.
During times like these we often have to sift through the rubble to find silver linings. Here are a random few as I write on this Tuesday morning.
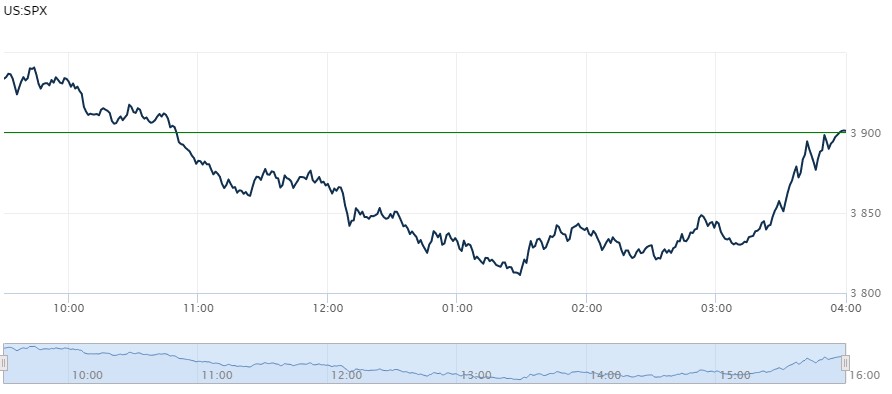
Major indexes like the S&P 500 eked out a positive close last Friday, even though they were down for the week. Stocks had opened higher Friday morning and, as has often been the case lately, promptly fell and seemed set to close on a dismal note. But then prices reversed higher in the last hour, even the last 15 minutes, of the trading day. This phenomenon has been around for a while and tends to be when the so-called smart money shows up.
Here's what this looked like on Friday. The smart money can go either way, but this sort of last-minute buying is positive. We got confirmation yesterday when futures were higher before the morning bell and the big indexes stayed higher for the whole session – a real anomaly these days. Markets are set to open lower again this morning, but at least Friday shows there are willing buyers out there.
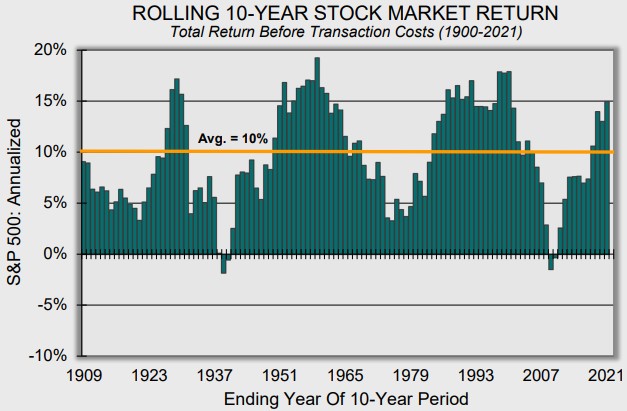
Retail investor sentiment has understandably gotten worse in recent weeks. How can that be a silver lining? Simply, extreme retail investor “bearishness” is a contrarian indicator. Fanning the flames, major financial news outlets are referring to current market volatility with terms like biblical, carnage, and even lost decade. Lost decade? There have been exceptionally few rolling ten-year periods when a well-diversified investor has lost money in the stock market. In fact, to go negative you’d have to end your 10yr period in the middle of the Great Depression or the Great Financial Crisis, according to Crestmont Research. There will always be those peddling doom and gloom, and the rising volume of their hyperbole is probably a contrarian indicator too.
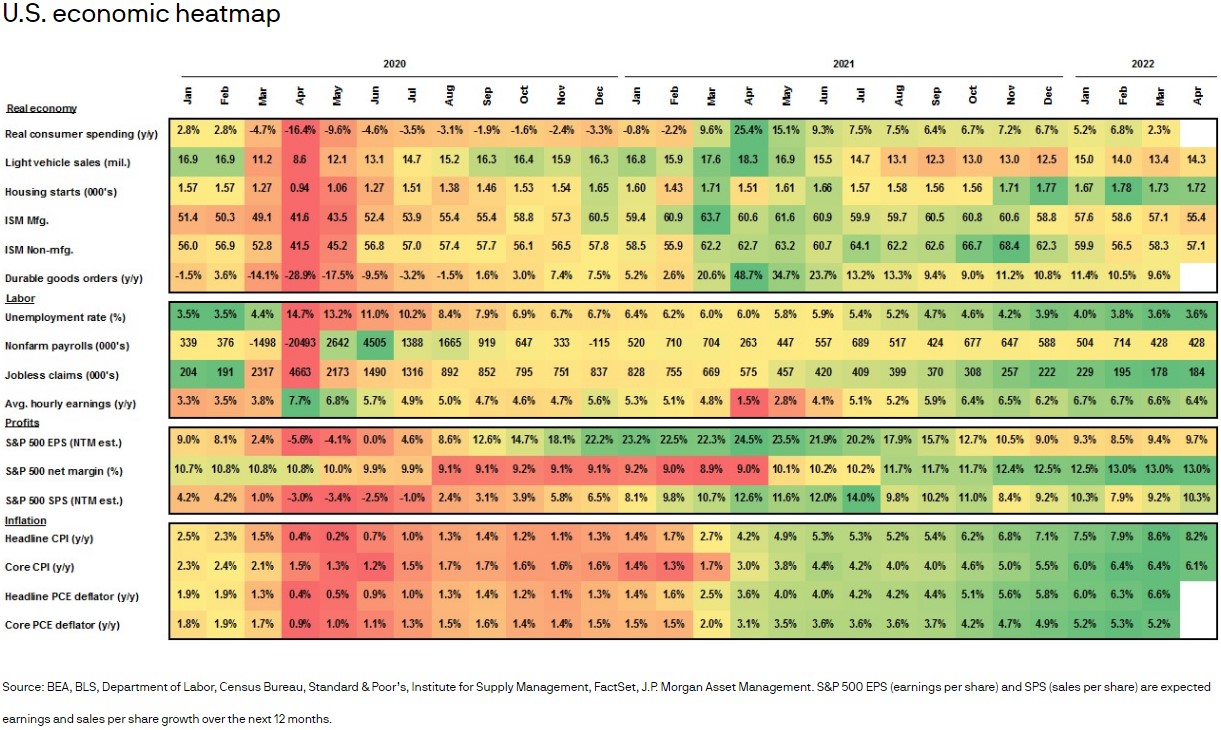
This economic indicator heatmap from JPMorgan contains lots of small type, but just look at the color difference from 2020 on the left to this year on the right – from red to green, poor to positive. The outlook is mixed and there are various opinions about a recession in the offing. “Recession” is defined by the National Bureau of Economic Research as a significant and widespread decline in economic activity lasting more than a few months, and its beginning and ending dates are only determined afterwards. Activity usually peaks heading into a recession and maybe that’s where we are now. But whatever comes next, our economy is still humming along even amid myriad issues.
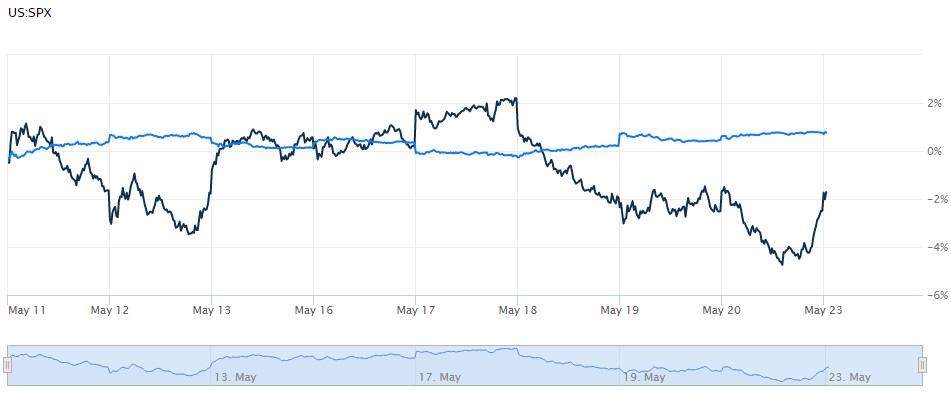
The bond market seems to have found it’s footing after falling, sometimes in lockstep, with stocks for much of this year. Bond performance has been a gut punch for more conservative investors who rely on bonds for cash flow but also for stability within their portfolios. The following chart shows the last ten days for stocks, the black line, and bonds, the blue line. High quality bonds should perform like this when stocks are challenged, so the last couple of weeks or so is a return to normalcy. Let’s hope it lasts.
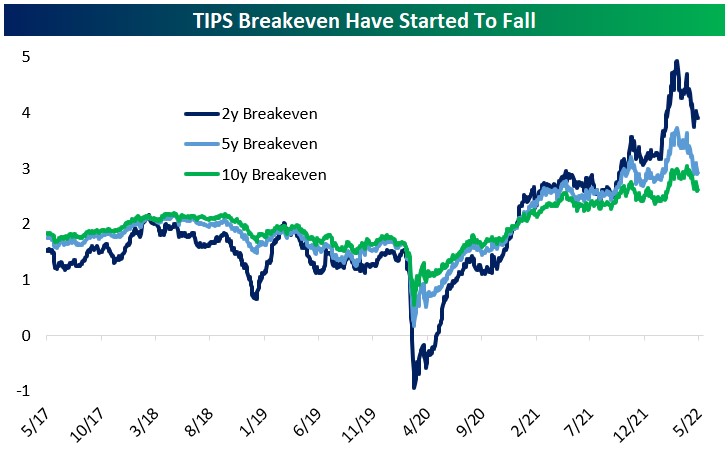
Also, bond investors are reassessing their fears of runaway inflation. There are many ways to gauge inflation expectations, and one way common in financial markets is to look at so-called breakevens in the Treasury Inflation-Protected securities, or TIPs, markets. These breakevens are trying to price the future direction of the Consumer Price Index and suggest lessening inflation pressure across the 2yr, 5yr, and 10yr timeframes. The chart below from Bespoke Investment Group shows this clearly, especially for CPI in the short-term. Maybe inflation ends up waning because we’ve entered a recession, or maybe it dies down for a host of other reasons. Either way, slowing inflation would be welcome by just about everybody.
Here's a link to the page about 10yr rolling periods. This isn’t a guarantee, just a historical perspective on the importance of thinking like a long-term investor – it’s a marathon, even an ultramarathon, and not a sprint. Sprinting would be like buying NFTs just because your favorite boxer gets paid to “influence” you to do so. Don’t let that be you.
https://www.crestmontresearch.com/docs/Stock-Rolling-Components.pdf
And here’s a link to the heatmap above so you can see the details more clearly.
Have questions? Ask me. I can help.
- Created on .


