60/40 Gets Pummeled
This has obviously been a bad year so far for long-term investors. Pick your asset class and it’s down year-to-date, and some are down much more than others. The real letdown, however, has been the bond market’s poor performance. We’ve talked about this and the reasons why before, but what’s interesting now that we’re near the halfway point this year is seeing how bond returns have impacted the traditional 60/40 stock/bond mix that is so prevalent across portfolios.
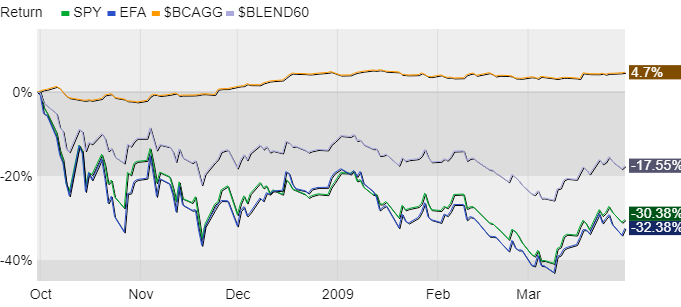
I’ve included some recent work on this topic below from my research partners at Bespoke Investment Group. But to give this some scale let’s first look at a couple of charts showing three major asset classes: US stocks (the green line), foreign stocks, (in blue), and US bonds (in orange). To these I’ve added a super-basic 60/40 portfolio mix (in lavender) so we can compare performance.
The first shows dates I cherrypicked from October 2008 through March 2009, the worst of the Great Financial Crisis. Owning the right kinds of bonds helped back then while the stock market was going nuts. It didn’t magically make your performance positive but took the edge off as shown in the spread below. Charts like this foster a certain amount of reliance on bonds as a source of strength within a portfolio.
Now let’s look at this year so far, a year that among other things has turned into one about interest rates (kryptonite for bonds). We see bonds falling more or less in tandem with stocks and a lack of the positive spread shown in the chart above. There have been glimmers, but they haven’t held very long.
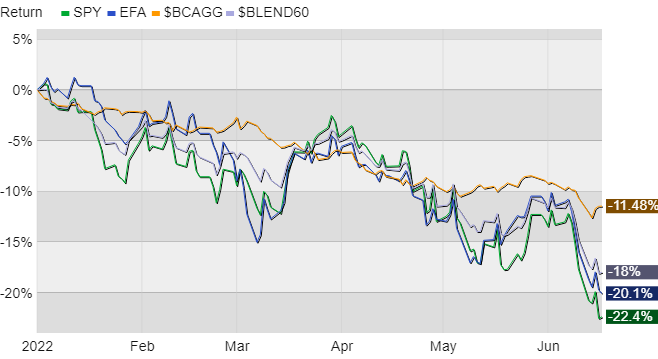
This performance tracks along with growing inflation fears and concerns about Fed interest rate policy and if/when it might trigger a recession. The Fed, as you’ll recall, briefly soothed investors in May and we see that in the orange line moving up that month. But then the Fed ripped off the Band-Aid recently with its largest single rate increase in decades to combat inflation at a 40yr high. Rate increases impact markets in a variety of ways but this time it’s sort of twisting the knife, so to speak, in the backs of investors who are merely trying to do as they’re supposed to by practicing the battle-tested approach of asset allocation. “Fairness” isn’t really something that fits within the context of stocks and bonds, but one shouldn’t be blamed for feeling a bit ill-treated by the markets this year.
Where to go from here? As I’ve mentioned before, at some point soon (hopefully) we’ll get to that point of ultimate capitulation and buyers will come back home to stay. In the meantime it’s all about ensuring your portfolio is structurally sound, rebalancing as needed, and harvesting losses as appropriate. Not much fun these days but critical in building and maintaining your portfolio for the duration.
From Bespoke…
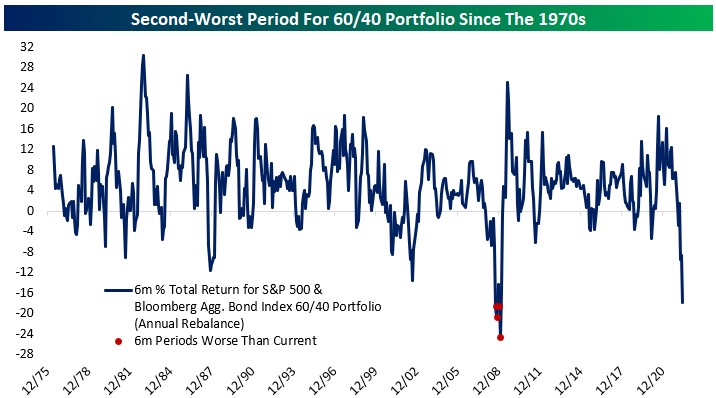
We are only halfway through June, but a 60/40 portfolio continues to get crushed by the combination of soaring bond yields and new equity bear market lows. Using mid-month data from June, a 60/40 portfolio is down nearly 18% in 2022. A similar asset allocation has started the year down over 6% twice previously, in 2002 and 2008. Nothing else comes close to the losses this year. Even looking at all six-month periods, the move since the end of last year is among the worst ever recorded. During 2008-2009, the utter collapse of stocks was a brutal hit to performance. But despite an enormous surge in credit spreads [this happens when investors sell risky bonds and buy safer Treasurys], bonds didn't drop very far or for very long. That's because Treasury yields plunged, driving gains from the risk-free component of the bond market. This time around, though, it's a very different story. While credit spreads have widened, far more important has been the huge surge in Treasury yields [investors sold Treasury bonds and caused yields to rise]. As a result, bonds have delivered -11.7% total returns this year, adding to - and arguably causing - the collapse in equity prices rather than offsetting the stock bear market.
We hope decision-makers (like the Fed) and pundits saying that we still need to see a "market flush" truly appreciate the wealth destruction seen so far this year. [Last week], Chair Powell thought financial conditions including equity performance were "appropriately" tightening, signaling he and other FOMC policymakers are satisfied with the pain in stock and bond markets. For the "average" person that only has a 401k retirement plan that's set to a 60/40 allocation, they're now not only dealing with 8%+ CPI and $5/gallon at the pump, but also the biggest shock to their retirement portfolios since the worst stretches of the Financial Crisis. Not even during the Dot Com Crash of the early 2000s did we see a six-month decline of this magnitude in 60/40 portfolios.
Of course, investor sentiment remains historically bearish after such large declines, and we definitely aren't hearing anything positive from market commentators that had been bullish leading up to the peak six months ago. In terms of historical analysis, most of our work shows that if you have longer than a one-year time horizon, now is the time to be putting money to work rather than raising cash. Remember, the goal is to buy low and sell high, not buy high and sell low! There's a reason the phrase "buy when there's blood in the streets" came into existence. Historically, it has worked. While there isn't an official "blood in the streets" indicator (maybe we'll make one!), we think the second-worst period for 60/40 in 50+ years at least comes close to qualifying.
Have questions? Ask me. I can help.
- Created on .


