Is Inflation Actually Getting Better?
So which is it, is inflation getting better or worse? You get different answers depending on who you ask. The impact of inflation can be intensely personal and people have stories to share, but investors and the markets care more about inflation at the “headline” level then about individual anecdotes. Metrics like the Consumer Price Index and variations on this theme that come from the government may seem less relevant when compared to your personal finances, but they do move markets.
As we’re all aware, official CPI numbers spiked a couple of summers ago following the pandemic before falling consistently. That helped drive stock prices higher and helped bonds as well. But CPI has flattened out for months now at a higher rate than officials at the Fed would like. That lack of direction has created a sort of information vacuum where theories and opinions abound. Maybe inflation is going to spike again like it has in the past. Or maybe inflation has reached a natural low point for this cycle and isn’t going all the way back down to the Fed’s 2% target anytime soon. Only time will tell but it could be awhile before we get a definitive answer.
In the meantime it’s important to remind ourselves that while past bouts of inflation have common traits, each has been unique and isn’t necessarily predictive. Along these lines let’s look at some work from my research partners at Bespoke Investment Group. They discuss the current inflation backdrop and provide some historical context. The bottom line seems to be that another big spike in inflation isn’t as likely as some would have us believe while consumer prices could remain higher than normal for a while. Markets can grind higher in that type of environment, but investors are still expecting less inflation and interest rate decreases from the Fed this year, so negative surprises there could bite a bit.
Now from Bespoke…
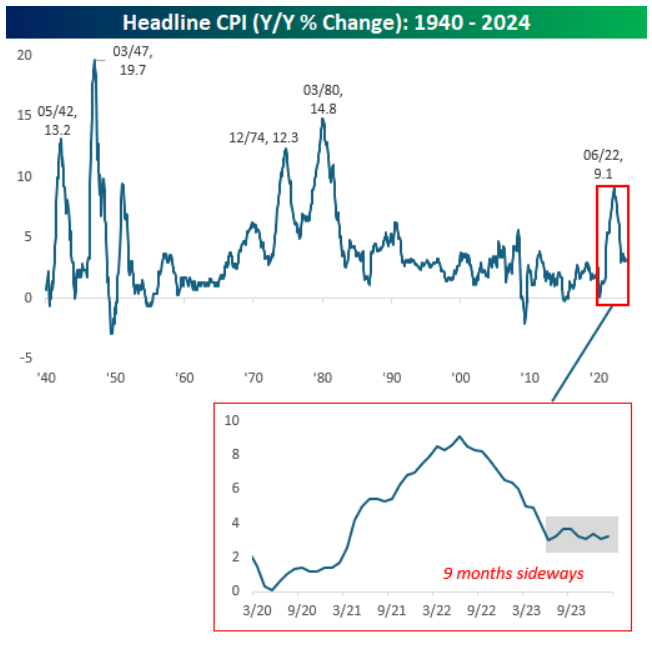
After headline CPI peaked above 9% in June 2022, the subsequent year of inflation data was a bull’s dream as reading after reading showed steady improvement. By June 2023, headline CPI was back down to 3%, and as is often the case, the most optimistic investors simply took the trend of the prior 12 months and extrapolated it forward, predicting 2% within a matter of months. For those investors, the last eight months have been frustrating as headline CPI has been bouncing around a range of 3.0% to 3.7%. With the progress on inflation stalled, the tide of sentiment at the extreme has turned from “inflation is going back to 2%” to “inflation is going to have a second wave higher just like it did in the 1940s and 1970s”.
Looking at the chart below, it’s easy to look at the post-Covid spike in inflation and not be concerned about the potential for a second wave like the ones that followed the prior two spikes during WWII and in the early 1970s. It’s a small sample size, though, and both periods had their own unique set of circumstances that are distinctly different from the current period.
In the 1940s, the US economy was contending with the shortages brought on by WWII in the first wave, whereas the second wave resulted from the pent-up demand and savings that accumulated during WWII. From that perspective, the current period has some similarities to the conditions surrounding the second wave of inflation in the 1940s but not the first. What’s worth pointing out about that period as well is that it didn’t take higher rates to get inflation back under control. In fact, throughout the 1940s, the Federal Reserve kept interest rates artificially low to finance the war, and the highest that the discount rate ever got during the decade was 1.5% in 1949.
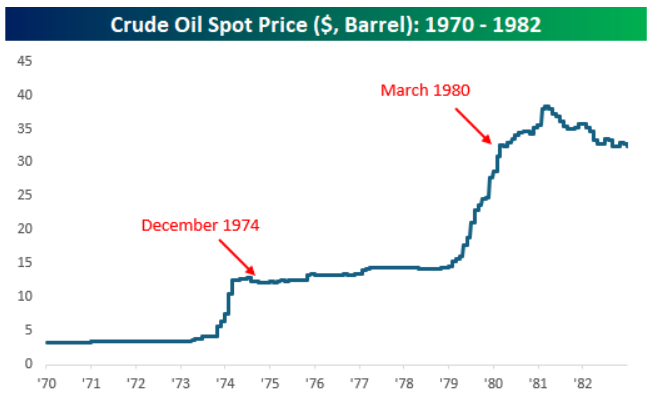
The cause of inflation in the 1970s waves was an entirely separate set of circumstances, but it can be summed up mostly by one word – oil. In the early 1970s, before the 1973 Arab oil embargo, a barrel of oil was less than $5. Once the embargo commenced, prices immediately spiked and more than tripled to over $12.50 in less than a year. As prices stabilized in 1974, inflation subsided back below 5% over the next two years, but they started to surge again in 1979 with the Iranian Revolution and the overthrow of the Shah. Over about a year, prices nearly tripled again, causing the second wave higher in prices. The geopolitical situation in the Middle East is hardly sanguine right now, and a wider conflict would likely cause upward pressure on oil prices, but the US is not as reliant on Middle Eastern oil as it was in the 1970s, nor is the US economy as energy intensive.
Whereas shortages of oil drove inflation higher in the 1970s, the post-Covid wave was a function of pent-up demand and labor shortages. Shutdowns caused millions of workers to lose their jobs, and the government stimulus programs enacted to stave off an economic calamity had the deleterious effect of disincentivizing labor to return to the workforce once the economy reopened. The result was spiking wages. Most people still remember the stories of McDonald’s not only offering high starting wages but also signing bonuses of $500 or more.
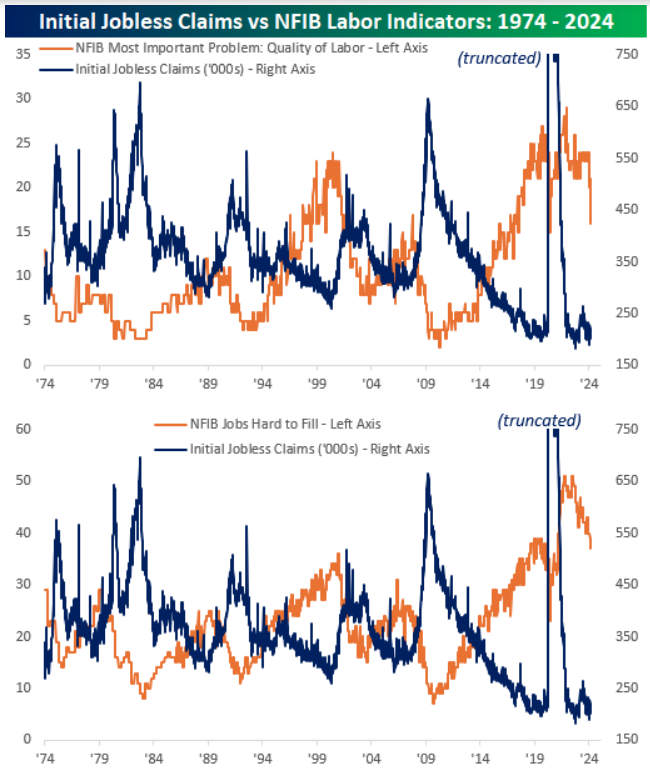
Today, the labor market remains on a good footing, but it’s not as tight as it was three years ago, diminishing the chances for a wage-price spiral that would fuel a second wave higher. The employment component of the ISM Services report has been gradually (but steadily) trending lower from its post-Covid high in 2021 and has even come in below 50 (boundary between growth and contraction) in two of the last three months. [Last week’s] release of the NFIB report on small business optimism for February also indicated labor market softening. The charts below compare weekly initial jobless claims to the percentage of small businesses citing the quality of labor as their single most important problem (top chart) and the percentage of businesses citing jobs as being hard to fill (bottom chart).
Coming out of the pandemic, a record 29% of businesses in late 2021 cited quality of labor as their single most important problem, but that reading has declined steadily since then and plunged in February, falling from 21% down to 16%. That’s the lowest level since the Covid lockdowns and before that the summer of 2017. For the percentage of businesses citing jobs as being hard to fill, it’s been a similar trend with February’s reading of 37% falling to the lowest level since early 2021. As you’ll note in the charts of each NFIB series shown below, when they start to trend lower, initial jobless claims tend to move in the opposite direction. We could make a list of potential factors that could spur a second wave higher in inflation that stretches down to the floor, but it doesn’t mean that any of them are likely to happen.
Have questions? Ask us. We can help.
- Created on .


