It's Tough Out There
It seems like more now than ever how the economy is doing depends on who you ask. People with assets like houses and stocks have been saying they’re doing well even if many are worried about the health of the republic. The wealth effect (the psychological boost from rising asset prices) is in full force for affluent folks. This shows up in consumer surveys and spending on categories like premium seats on flights, fancier cabins on cruises, and “sustainable luxury” versions of electronic vehicles, to name a few.
Many of these people are also in the top 10% of earners who account for nearly 50% of all consumer spending in our economy. The rest are in the next 10% and add roughly another 10% to spending and round out the 20% of those considered affluent.
Perhaps capturing responses more from this affluent cohort, the Wall Street Journal had an interesting survey-based article in recent days. Here's a link: https://www.wsj.com/politics/policy/economic-outlook-sentiment-poll-quiz-99d71df8?st=8AZjVe&reflink=share_mobilewebshare
All this spending has been buoying the economy for a while and helps reduce recession risk, but the rising tide hasn’t been lifting all boats.
The other 80% of consumers cover the remaining 40% of spending and many (maybe most) of these folks are strained. Sustained inflation in key areas, a tight job market and stagnant wages, high borrowing costs, and repaying student loans – one or all these are hitting the average American consumer pretty hard. And the impacts tend to worsen as you go down the age spectrum.
This is an important structural issue within an otherwise healthy economy. While not necessarily new information, numerous sources have been reporting lately how the yawning wage and opportunity gap continues to widen. This is especially important with emerging AI technology and the lofty expectations for how it might impact the workforce.
My research partners at Bespoke Investment Group came out with a good piece last week looking at how younger Americans are doing economically when compared to other generations. Some of their findings are interesting, such as high unemployment rates for 20-somethings with a college degree versus their high school educated peers. This post is a little longer than normal due to several charts, but I’ll appreciate your patience.
From Bespoke…
There’s nothing new about concerns over “kids these days”. We can go back at least as far as the late Roman Republic and their fear of novo homo (new men) like Julius Caesar for conflict over and between generations. Today we’re going to take a look at the plight of younger Americans and how they’re performing economically.
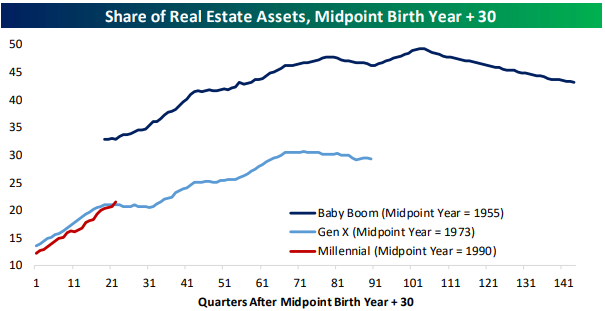
First, we’ll start by looking at the distribution of wealth. With younger or first-time home buyers largely locked out of the housing market which has for so long been an engine of wealth for the American middle class, it’s easy to assume that Millennials (and their younger peers in Gen Z) will forever be locked out of the housing market. For now, that’s not what’s happening. As shown below, Millennials’ (defined as Americans born in 1980 or later) share of real estate wealth in aggregate is ahead of where Gen X (Born 1965-1980) was at the equivalent point for their generation. Granted, Gen X is much smaller than the Millennials, and both are well behind compared to the Baby Boomers (1946-1964).
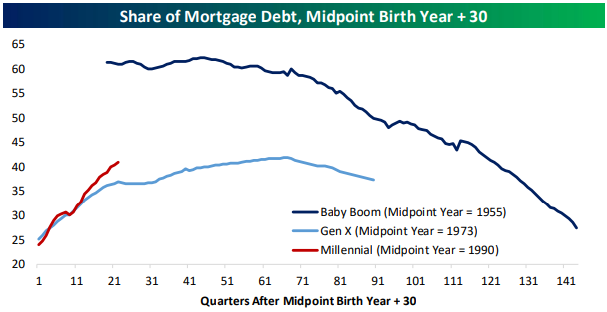
Assets also don’t account for the debt that underpins them and in that respect the share of mortgage debt held by Millennials is an indication that they are at somewhat of a disadvantage relative to older generations. As shown in the chart top right, share of mortgage debt is far higher than Gen X was at this point (though again, well below that of Baby Boomers).
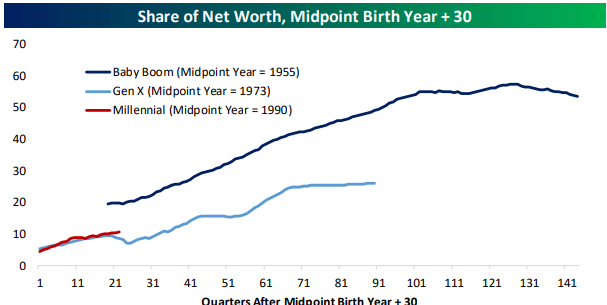
The Fed’s Distributional Financial Accounts are the source for this data and they don’t break out Gen Z yet; they are likely less than 1% of any net worth or asset figure given their age and the experience of Gen X and Millennials. That said, Millennials hold a greater share of net worth at present than Gen X did at their equivalent age. While their share of net worth is about half what the Baby Boomer’s was at this stage, the difference is much less significant than the current share of net worth controlled by the Baby Boomers compared to younger Americans.
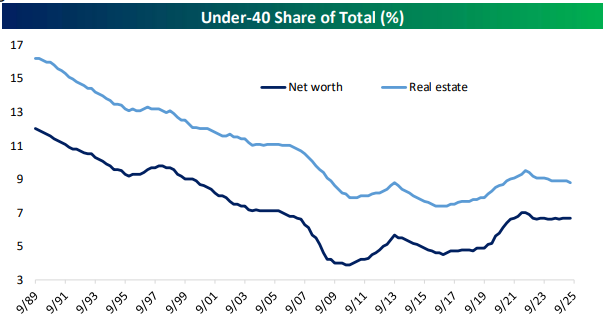
The DFA data also lets us look at specifically under40s share of net worth and assets. As shown below, it has trended higher over the past 15 years, a stark contrast to the 1990s and 2000s (this data begins in 1989). In short, from a wealth perspective, younger Americans look to be worse off than previous generations in terms of share, but not dramatically so, and are building wealth on a trajectory similar to prior generations.
What about income? In the chart at right we show the median same-worker hourly wage growth by age, which is reported in the Atlanta Fed’s Wage Tracker as 12m moving averages for these demographic slices. As shown, the hot 2020-2021 labor market led to massive wage growth for younger workers, easily the highest since at least the late 1990s. Since, we’ve seen a massive decline. It’s important to keep in mind that the youngest workers always see the fastest wage growth. By virtue of both educational attainment happening early and low hanging fruit of productivity improvements happening earliest in a given worker’s career, every cohort of workers always experiences their fastest wage and salary growth in their 20s, before settling down into a much slower pace of growth that reflects the aggregate labor force.
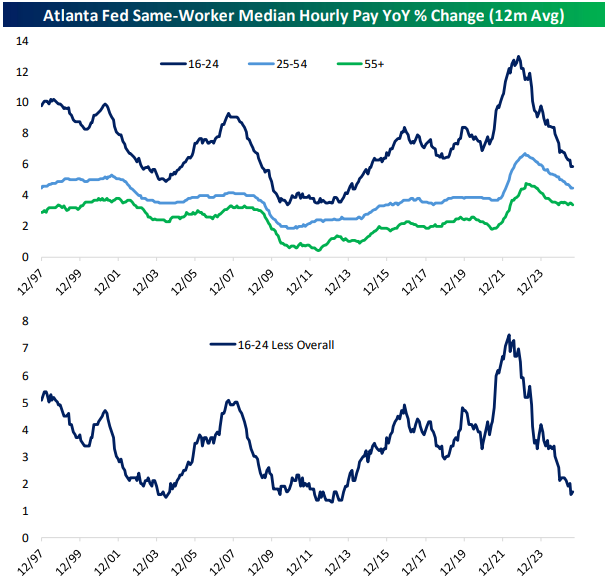
That same dynamic is still true today, but we do note that young workers are seeing weak relative wage growth. Their advantage in the Atlanta Fed data is similar to what we saw in the extremely weak labor market of the early 2010s when national unemployment was still in a 6%-10% range and aggregate wage growth was much weaker. We should probably discount some of the weakness given the “overshoot” of wage growth in the early 2020s, but by any measure this labor market is generating relatively weak wage growth for the youngest workers, which implies relatively soft aggregate income growth as well. In other words: something is going on.
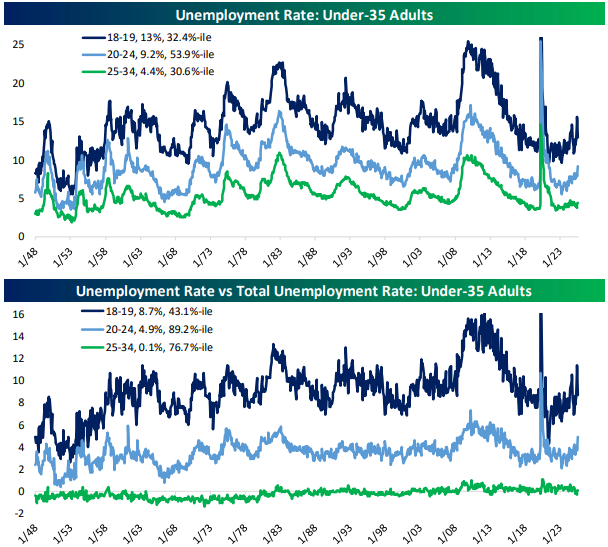
What about unemployment? Teenage unemployment looks relatively normal and similar to unemployment for 25-34 year-olds in terms of historical percentile. But 20-24 year olds have unemployment rates above the historical median and they’re rising quickly. That’s even more evident when we adjust for the national unemployment rate. After doing so, some things jump out. Teen adult unemployment is slightly lower than history on that relative basis, while 20-24 unemployment is near the 90th percentile! 25-34 unemployment is also higher than 76% of history relative to the national rate. What’s even more remarkable is that these spreads tend to be cyclical; we are not in the midst of a recession (when they historically tend to spike).
Recent announcements of job cuts from major companies have repeatedly come for the white collar labor force; in general this looks like reduced corporate head count with no impact on line or production workers. That helps illustrate a key dynamic in the labor market right now: the problem is less youth unemployment and more college educated unemployment. To illustrate, in the chart below we show the current percentile reading of unemployment relative to the national rate. Lower readings mean less joblessness for a given demographic relative to history and vice versa. As shown, for 16-24 year olds not enrolled in college and without a high school diploma, unemployment is historically low, in the bottom 4% of readings. Compare that to those not enrolled in college but with a high school degree, where unemployment is more elevated at the 70th percentile. And for 16-24 year-olds who are not enrolled in college having already earned a degree, unemployment relative to the national total is in the 95th percentile!
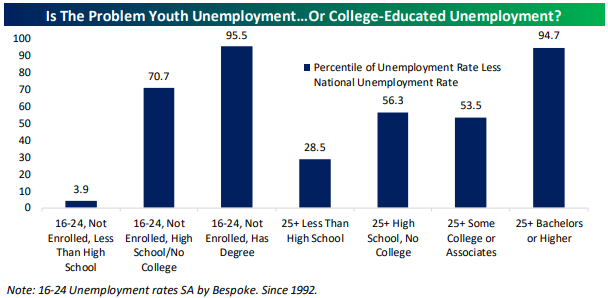
What makes this so striking is that we see the same pattern play out for older, more seasoned workers. Those with less than high school have low unemployment relative to the national economy and history, while those with college degrees are in a much tougher spot (again, relative to the total picture and compared to history).
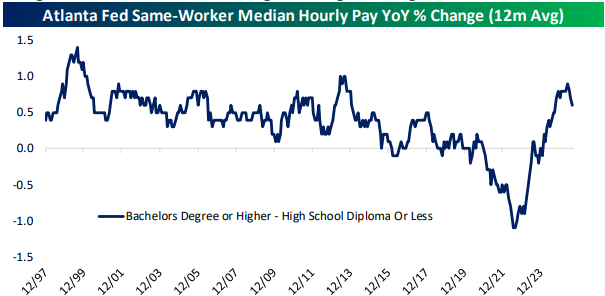
The hot 2020-2021 labor market may have been a taste of what is to come given the rising unemployment among college graduates. Until that period, it was extremely unusual for college-educated workers to see wages rise slower than those with less education. But lesseducated workers outperformed dramatically in that tight labor market. Normalcy has returned over the past couple of years but recent data shows college-educated workers starting to lose ground again.
We haven’t talked at all about the causes of this shift yet, but the data supports the view that something is driving down demand for collegeeducated workers relative to supply of those workers. We see a range of possible explanations. One could be that more remote work has reduced the labor bargaining power of college educated workers in a given geography, eroding their wage premium or demand for their labor in aggregate. Another is that far higher prevalence of college educated labor (given that Millennials are by far the best-educated generation in terms of attainment and Gen Z is similar) means supply is outweighing demand. A third explanation is that the processes of management intensification and financialization in the 1990s through 2010s overshot and firms are now focused on simplifying operations to focus on line production. And AI is a final potential catalyst, though we note that this process appears to have been underway long before ChatGPT was released let alone widespread adoption of LLMs.
Have questions? Ask us. We can help.
- Created on .


