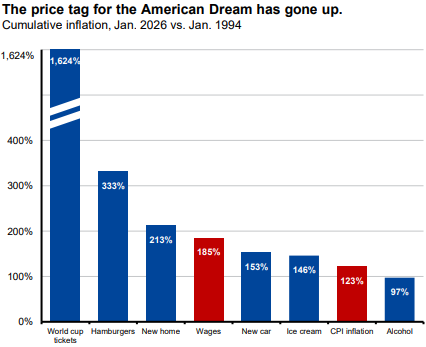
Before I begin this morning, here’s an interesting chart I received yesterday from JPMorgan looking at inflation since the last time the World Cup was held here in 1994. Not much commentary but look at the red bars compared to the blue… wages averaged higher than the CPI, but both were exceeded by at least a few items. How we spend our money absolutely impacts how we experience inflation.
Okay, on to this week’s post…
You’re familiar with the “4% Rule”, right? You’ve read about it and have likely heard financial people like me talk about it. The “rule” has been around for decades now and occasionally bubbles up in the financial press and elsewhere. What’s interesting about this is how concepts can grow within the culture to develop lives of their own that only loosely resemble the original intention.
This is especially true in this case. During the 90’s a financial advisor, Bill Bengen, wrote academic papers and eventually a book detailing how retirees could safely plan to spend their savings. The work, Bengen said, was written mostly as a response to the dearth of academic research backing up the wide variety of responses one would get to the “How much money can I withdraw from my savings during retirement?” question. Some said 7% or more per year, sometimes much more (because the stock market was doing so well as the Tech Bubble expanded). Some said much less. What was a solid answer that went beyond rules of thumb?
To oversimplify, Bengen did a bunch of spreadsheet analysis to test various scenarios. He made asset allocation, rebalancing, and longevity assumptions, used historical asset class returns and annual inflation data going back to 1926, and put it all into Excel spreadsheets. He then modeled nearly 400 retirees to test what annual withdrawal rate allowed each individual to not run out of money during their lifetime. The results were heavily impacted by timing and the economic and market dynamics at the beginning and during the early years of retirement. His original work showed a 4.1% withdrawal rate as a worse-case scenario, meaning the annual withdrawal rate for someone who retired at the worst possible time. He rounded this down to 4%, wrote about it in the financial press and the rest, as they say, is history. Since then it’s solidified into something like a law of personal finance, even though it was never intended to be.
Interestingly, Bill Bengen didn’t originally refer to his findings as the 4% Rule and speaks of being a “reluctant midwife” to what became a rule of thumb like he was originally trying to get beyond. Last year he wrote a new book on the topic. It’s a fascinating update to the concept/rule/law that has been present during my 20+ year career so far.
In this recent book, A Richer Retirement, Bengen adds asset classes and other data to his original analysis to determine an updated safe withdrawal rate, the SAFEMAX. Among other things, these updates suggest that one’s SAFEMAX could now be 4.7%, although timing and myriad other issues will probably make yours different. That doesn’t sound like a hard and fast rule, does it? More like a good place to start.
In truth, neither the 4% Rule nor variations on the theme are meant to be standalone planning tools, but we have to acknowledge how easy it is for people to take a good idea and stretch it too far.
I’ve always thought of these rules of thumb as being good for back-of-the-envelope planning. Meaning, you’re sitting in traffic on your way to the office and doing some fuzzy math while dreaming about retirement. You’ve saved $X in your 401(k) and 4.7% of that per year is $Y, etc, etc. Unfortunately, this is about as far as people get before complicating questions like these come flooding in…
How does Social Security impact this?
What about shifting inflation and taxes?
What about selling our home and downsizing?
How do we pay for the new roof and HVAC we know we’ll eventually need, plus replacing cars, and helping our grandkids get through school?
How about paying for care needs down the road?
What if I work part time for a while?
With all this and more, can we still afford to retire?
These questions have timing and dollar amounts attached to them and each impacts your portfolio withdrawal rates year-to-year, sometimes dramatically. This makes having a dynamic strategy so important. Fortunately, specialized software lets us plot out the amount and timing of expected income and planned spending, while including inflation and taxes, investment returns and market volatility, longevity risk, and other factors. We can use all this data to build scenarios and stress test them. None of that acts as a guarantee, but it’s certainly more robust than fuzzy math and a legal pad.
I didn’t intend for this post to get so salesy, but there you have it.
Have questions? Ask us. We can help.
