In recent weeks we’ve been covering some of the stuff you can and should be doing with your investments as we approach year-end. Today let’s add a final layer – the overall portfolio review.
Now, I’m of the opinion that you should be doing this frequently as a back-of-the-envelope check on things, especially during down markets. But if you’re only doing this once it might as well be at the end of the year.
Here’s the rough framework I use when reviewing a client’s portfolio.
- Have your needs changed?
- We’ve seen lots of volatility in all asset classes this year, even typical safe havens. This makes it tough to be a long-term investor. That’s obvious but it’s helpful to acknowledge the difference between how you feel about short-term performance and your actual financial situation.
- Have your financial needs changed recently? Have you retired from, lost, or gained a job? Have you received an inheritance? Has your health taken an unexpected turn?
- A “Yes” answer to any (and more) of these types of questions indicates the potential need to change your investment mix. At minimum it’s a good reason to talk with your humble financial planner to see what, if anything, you should be doing differently.
- How does #1 impact your investment decisions, if at all?
- Maybe you’ll need cash soon for large expenses or just to get by.
- Or maybe a new job or inheritance could let you save more.
- Often, your needs haven’t really changed so there’s no meaningful impact to your investments. If so, you’ll want to be careful about making changes for the sake of making changes. I tend to look a lot more than I do.
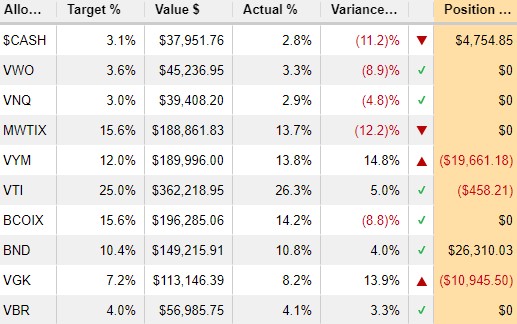
- Then consider your investment allocation and portfolio structure. Is it still appropriate?
- Assuming numbers 1-2 indicate no impact, and assuming you’ve been managing your portfolio for awhile and know the how’s and why’s of each investment, you can move on to basic rebalancing.
- But let’s say 1-2 indicate a need for regular draws from your portfolio. Stock funds pay dividends quarterly and bond funds pay monthly. It can be helpful to turn off automatic reinvestment settings for your account to allow cash to accumulate. Then link your account to your bank and take money out on a schedule or as-needed.
- Or maybe you need less money from your investments, or perhaps none at all. If so, ensure automatic reinvestments are turned on, especially in long-term accounts like Roth IRAs. This helps keep your money working while you’re not paying attention.
- If you sense a mismatch between your allocation and your financial situation, look to make changes within your retirement accounts first. The reason is that you won’t have to worry about taxes when moving money between investments.
- If you need to ratchet down your portfolio risk, a straightforward approach is to shift money from various stock funds into an index fund that tracks the S&P 500, or perhaps a variation that emphasizes dividend payers within the S&P 500. On the bond side, reduce the “duration” of the bonds in your portfolio while increasing credit quality. Duration is quoted in years and lower earns less over time but can be less volatile. This makes higher-quality lower duration bonds a good option for ringfencing spending money over perhaps a couple of years.
- If ratcheting risk up instead, you can use the same S&P 500 index funds but just buy more. There are other asset classes such as emerging markets, preferred stocks, and junk bonds to juice up return potential, and all are at a discount right now. But each adds volatility too, so caveat emptor.
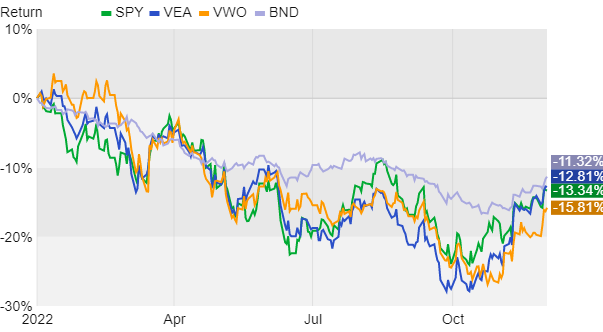
- What has and hasn’t worked this year and what’s the outlook?
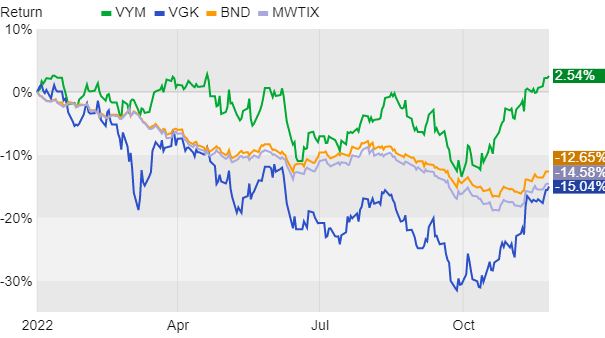
- The worst performing indexes so far this year include the NASDAQ, down about 29% and micro-cap stocks down about 22%. Large-cap indexes like the S&P 500 are down around 16%. Core bonds are down 12+%. What’s tough is that none of these areas are bad, they’re just down right now. In fact, stretch performance out over a 5yr period (or longer) and the order of performance gets reversed, with the NASDAQ up 89% over that timeframe including this year! Time in the markets works while timing them does not.
- Your “dividend” funds are likely doing better, as are specific sectors such as Energy, Utilities, Consumer Staples, and Healthcare. Short-term and municipal bonds are doing better on their side of the fence too.
- Because of this mixed performance there should be some decent rebalancing opportunities like we discussed a couple of weeks back.
- For the outlook, inflation is slowly cooling down and the Fed is expected to raise rates just5% this week. A recession of some severity is still expected, but expectations aren’t as dire as a few months ago. That said, markets will continue be volatile until all this gets sorted out, likely well into next year.
- You’ll want to stay invested and diversified because markets can and do rise amid all this uncertainty.
- Look at your investments for anything that stands out based on numbers 1-4 above. A common mismatch is long-dated and/or lower credit quality bonds holding short-term spending money. Or crypto variations used as a cash equivalent. Another is an unintentional overemphasis on a volatile asset class. Beyond that, if anything seems too confusing, duplicative, or expensive, now is a great time to fix the problem.
Managing investments is primarily an exercise in controlling what can be controlled. We double down on this in bad markets. Each investment in your portfolio should be there for a reason and the mix should make sense. If so, and your costs are low you can at least check the box for being diligent, whatever the markets may throw at you.
And you don’t have to worry about these details if we’re managing your portfolio – we’ve got you covered. As always, let us know of important changes in your life and ask questions.
Have questions? Ask me. I can help.
- Created on .