A Quick Bond Update
This week let’s look at an article about the bond market from Kathy Jones, head fixed income strategist at Schwab. Ms. Jones does a good job explaining what’s been happening with bonds, where we are now, and maybe some silver linings. A general understanding of this is important because it helps us understand why performance has been suffering, and because the bond market acts as a gauge on recession risk.
Here are some snippets [with notes added by me] and a link to the entire article is provided below.
The bond market has priced in a fast, steep tightening cycle by the Fed.
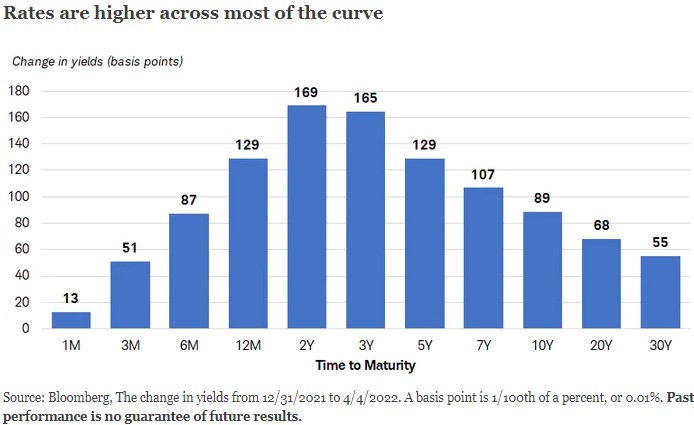
A lot has changed in the past few months—mainly the Federal Reserve's policy stance. Until December, the Fed was focused on the potential negative economic fallout from the pandemic and was cautious about exiting its very easy policy stance. The stronger-than-expected recovery, along with the spike in commodity prices due to Russia's invasion of Ukraine, forced the Fed and other central banks to shift toward tighter policy. Consequently, yields jumped across the curve, led by a steep rise in short-term rates. [The following chart is only through 4/4 but the shape is roughly the same today. It also illustrates a key point: bond investors are focused on this short-term 2-3yr timeframe as riskiest while being fairly sanguine about the longer-term outlook.]
Yield curve signals.
The market is now discounting a fast pace of Fed rate hikes, with the federal funds rate expected to reach as high as 3% in early 2023 [up from 0.5% currently]. Considering that the Fed has only raised rates once, a lot of future rate hikes are already being discounted by the market. [As of this writing the bond market is pricing in a 90%+ chance of a half-point increase by the Fed at its next meeting in May.] It's important to note however, that the market is also discounting a few rate cuts in 2024.
Yields are now converging between two-year to 10-year maturities. They are currently above the Fed's longer-run estimate of the "neutral rate" of about 2.5%—the rate that is low enough to support economic growth but high enough to keep inflation in check. In past cycles, when the yield curve flattens near the neutral rate, it has been near the peak in long-term rates.
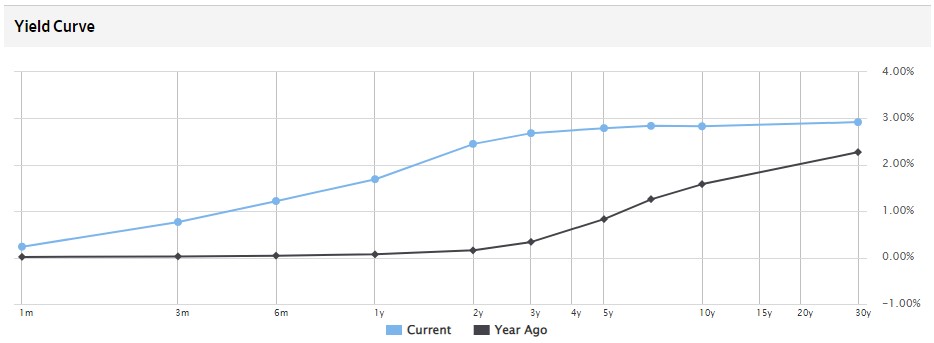
In the past few weeks, parts of the Treasury yield have inverted. Ten-year yields are lower than five-year yields, and the much-watched two-year/10-year yield spread dipped into negative territory briefly. Yield curve inversions raise concerns because they have historically preceded recessions. [We discussed this recently and the 2yr/10yr curve that’s popular to watch as a recession indicator actually “unverted” pretty quickly after inverting. The 7yr/10yr curve is very tight, inverting and unverting as I write, but this particular combo isn’t seen as an important indicator. I’ll be watching closely in the weeks ahead to see if another inversion of the 2yr/10yr occurs and if it sticks. Here’s a yield curve chart from The Wall Street Journal so you can see where we’re at now. You’d see the inversion as the blue line dipping between points, whereas from 5yrs out it looks pretty flat.]
What about inflation?
The biggest concern for fixed income investors is inflation. Although it's likely to remain high in the near term due to rising commodity prices, we expect it to ease later in the year—providing some relief for bond investors. The economy is showing signs of cooling off after a sharp rebound from pandemic lows. It appears that a lot of consumption was likely pulled forward by the combination of easy fiscal and monetary policies last year. Now the pace is moderating, especially in key areas where in financing costs are rising—like capital expenditures and housing.
The housing market is feeling the pinch of higher interest rates. Mortgage applications for purchases and refinancings have dropped sharply and new home sales have fallen from peak levels of 2021. It appears that the housing boom may be over. Since a lot of consumption has been tied to the housing market, the slowdown is significant. [I don’t think she’s implying that a housing market crash is imminent, just that the slowdown of double-digit year-over-year gains in house prices has likely already begun. But this is a national average. I’m still hearing stories of multiple all-cash/over-asking offers on homes in geographically dispersed markets.]
Long-term inflation expectations have increased only modestly.
You wouldn't know it from reading the financial news or listening to the most hawkish central bankers, but inflation expectations appear reasonably contained. The markets are discounting high inflation in the near term, but also an aggressive tightening cycle that will pull it lower longer term.
The University of Michigan consumer sentiment survey indicated that near-term inflation expectations are high and continue to rise. Not surprisingly, short-term inflation expectations tend to be highly correlated with oil and gasoline prices. However, despite the steep rise in prices recently, five-to-10-year inflation expectations are sitting at 3%, which happens to be the long-term average dating back to the 1990s. In other words, consumers don't expect this inflation spike to last at the elevated rates we've seen recently. [Now look again at the bar chart above to clearly see how this thinking has impacted the bond market.]
Opportunities for income.
We are finally getting positive on the outlook for intermediate to long-term bonds. After spending the better part of the past few years suggesting investors keep average portfolio duration low due to the risk of rising yields, we are now in favor of adding duration (that is, some slightly longer-term bonds), and selective credit risk. What changed? Yields and the stance of Fed policy.
The risk/reward has improved now that yields have jumped up and the signs from the yield curve suggest the peak in yields for the cycle may be getting closer. There may be some more upside in yields if inflation proves more stubborn than we expect, but with the Fed all-in on bringing it down and the curve flattening, the collective wisdom of the market is suggesting that yields are likely to plateau or move down.
[As I’ve mentioned a few times in recent weeks, the bond market may be overly pessimistic, so a “plateau” sometime soon would be welcome. Core bonds are down approaching 9% year-to-date, underperforming the S&P 500 if you can believe that. Just plain painful for conservative investors. But, as the article suggests, cash flow from bonds should rise over time and that will help.]
Here’s the link to the full article.
https://www.schwab.com/resource-center/insights/content/last-income-fixed-income-market?cmp=em-QYD
Have questions? Ask me. I can help.
- Created on .


