M*A*S*H and Cash
This morning I’d like to share two loosely related things with you. First, it’s a little TV history with some interesting market context. Second, it’s a look at how to think about cash these days.
This first note and two charts came via a morning email from my research partners at Bespoke Investment Group. I also heard about this anniversary on the radio while driving my son to school and he asked, “Mash, what’s that?” I again reminded myself that so much of what’s important to our culture at the time can end up having zero relevance for future generations. Or perhaps the optimistic view is that aspects of our culture can take on renewed relevance as a new generation rediscovers it…
Anyway, I have fond memories of M*A*S*H, although mostly from watching late-night reruns, and couldn’t pass up sharing this with you.
From Bespoke…
40 years ago, tonight, nearly half of all Americans and three-quarters of all TVs in the United States were tuned into the same channel. Never had such a large number of Americans watched the same event at the same time. What were they watching? It wasn’t the Super Bowl. The Redskins had already beaten the Dolphins a month earlier after the strike-shortened season. No, on this Monday night, they were watching Hawkeye Pierce leave the 4077th Mobile Army Surgical Hospital for the last time on the series finale of M.A.S.H. Outside of its first season in 1972, when the show was almost canceled, M.A.S.H. was one of the top-rated shows on TV in every other season of its eleven-year run. M.A.S.H. fans watched the series finale and were sad to see it go, but subconsciously many of them were probably saying good riddance.
M.A.S.H. coincided with a dark period in the American economy, and its end can be looked back on as being symbolic of throwing some of the last vestiges of the 1970s behind us. The fact that the most popular comedy of the 1970s and early 1980s was set on a hospital base in a war zone where the plot of nearly every episode was interrupted by an incoming influx of war casualties says all you need to know about the psyche of Americans in the 1970s.
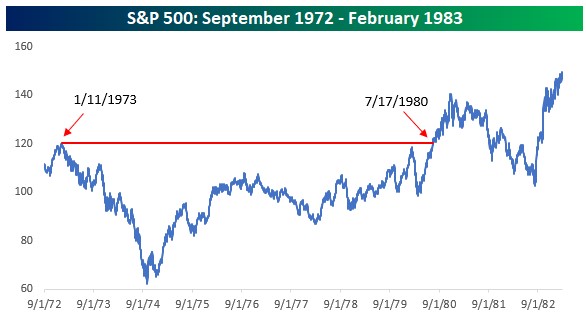
The chart below shows the performance of the S&P 500 from the first episode of M.A.S.H in September 1972 to the series finale in February 1983. Less than four months after the show first aired, the S&P 500 peaked and went on to lose nearly half of its value over the next 18 months before bottoming out and slowly reclaiming the declines of the bear market over the next several years. In fact, it took three-quarters of a decade before stocks finally made new highs again, and the real breakout of the 1980s bull market wasn’t for another two years after that in August 1982, six months before the show ended.
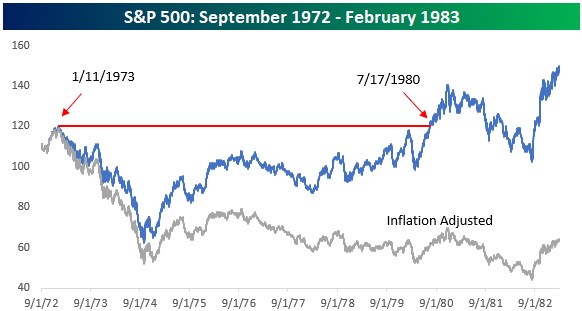
The performance of the S&P 500 during M.A.S.H. was bad enough in nominal terms, but when you factor in the crushing inflation of that period into the equation, performance was even weaker. After deflating the S&P 500 by headline CPI during the 1970s and early 1980s (gray line), you can see why M.A.S.H was a period of American history many were happy to forget. Is it any surprise that after a decade of high inflation, war, and general economic malaise, that as M.A.S.H. was getting ready to sign off, Americans were now turning the channel to a washed-up baseball player running a bar in Boston? Americans were ready for a drink. Cheers!
How to think about cash…
As you’re no doubt aware, recent months have seen a dramatic change in the interest rate environment. This is in large part due to how the Fed is fighting inflation and blowback in the markets has been negative, sometimes severe. But a positive has been that cash (a catchall term for bank accounts, CDs, money market funds, and very short-term bonds) now yields more than it has in years. Bank CDs offer from 4-5%, and so does the Treasury market. A year or so ago they all yielded 1% or less.
Following a year of volatility, investors are understandably a bit exhausted. In that context, higher yields on cash presents interesting questions like –
If I can get 5% on a CD, shouldn’t I put all of my money there and sit on the sidelines for a year?
If I’m retired, can I rely on cash investments for income?
Is cash an investment? If not, how should I think about cash?
These questions have been percolating and today I see this note from JPMorgan that does a good job of addressing them. I’m presenting it here with a chart at the bottom and will italicize any notes from me.
The bottom line, I think, is that cash does a specific job well but it’s at the bottom of the risk/reward pyramid for a reason – growth comes from risk and cash, by design, doesn’t have any.
From JPMorgan –
For the better part of the last 15 years, cash has decidedly not been “king.” More recently, however, the relative attractiveness of cash instruments has increased. The Federal Reserve (Fed), working to fight persistent high inflation, has raised rates at the most aggressive pace in decades and to the highest level since the Great Financial Crisis. This, in turn, has lifted cash yields, and the average 6-month Certificate of Deposit (CD) in the U.S. now has an annualized yield of 1.86%, with some 12-month CDs offering yields of nearly 5%. (As of this writing www.bankrate.com shows an 11-month CD from Capital One at 5%. Bankrate.com is a great resource to quickly check where the online banks are with CD rates – a good way to keep your local bank honest.) As a result, for the first time in a long time, cash is no longer just a parking lot for “dry powder”; instead, some may believe that it can further income goals, too.
However, despite the rapid rise in yields, investors must consider if CDs and other cash instruments are the best place to allocate capital. In other words, they must ask: should CDs be a part of portfolio construction?
As with many things in today’s investment universe, the answer to this question is not black or white, but rather gray. Investors may therefore be best served by thinking about asset allocation in terms of both liquidity and income needs and also opportunity cost.
All investors have liquidity and income needs. These needs are amplified or diminished by a number of factors, including risk tolerance, age and wealth. To address these needs, a simple framework would be a good place to begin the asset allocation discussion:
Identify typical liquidity or income needs (e.g., average annual expenditures).
Identify atypical liquidity needs that may arise (e.g., medical expenses) or are expected (e.g., purchasing a second home).
Determine how many years of risk-free liquidity or income is required, based on risk tolerance.
Build up a cash reserve based on the aforementioned criteria. These cash reserves can be constructed using CDs (which have the added benefit of FDIC insurance) or Money Market Funds (MMFs), which lack insurance but are still ultra-high quality, have no lock-up period, and in some instances have a superior yield and have seen significant inflows in recent months.
Once liquidity needs are addressed, investors should consider opportunity cost and allocate every extra dollar to risk assets. (You may have heard me talk about putting cash in “buckets” – one short-term that should always be cash at the bank, one for medium-term expenses, or just for personal comfort, that can be made up of short-term bonds, while bucket three is money that should be invested or you risk paying too high an opportunity cost over time.)
Some considerations include:
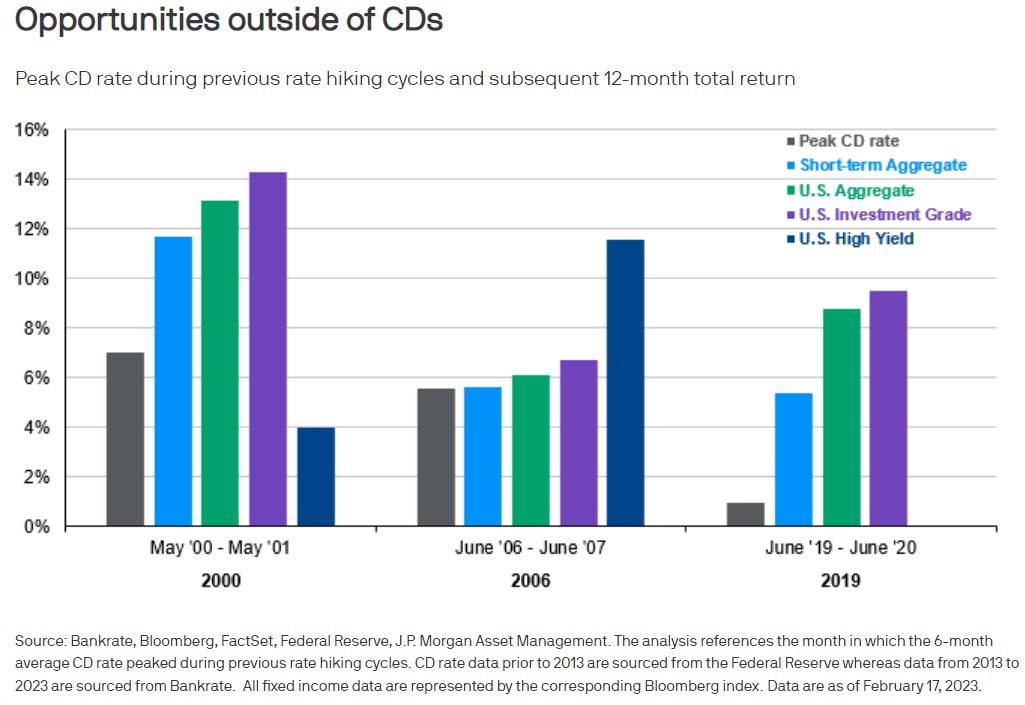
Significant negative performance in 2022 has set the stage for a powerful rebound in the stock market. For example, the S&P 500 is still 15% off its January 2022 peak of 4,797 despite a recent run higher. Even annualized over a multi-year recovery period, this figure is more impressive than the typical cash yield.
Many high quality fixed income instruments have yields that are comparable to cash. In addition, these yields can be captured for longer provided the instrument has sufficient duration (high CD yields are likely fleeting, especially if the Fed lowers interest rates in 2024).
Within the fixed income universe, duration has the added benefit of providing a buffer against volatility in a portfolio, especially in the case of a recession. For example, a 1% parallel shift lower in the Treasury yield curve will result in a return of 11% from the Bloomberg U.S. Aggregate index.
Ultimately, the conversation around cash and traditional long-term assets should not be framed as “either/or”, but rather as “both, for different reasons.” It is impossible to dismiss that cash remains a safe-haven asset and has become a viable income generator; but it is similarly impossible to dismiss the notion that there are not better places to park excess capital. For this reason, investors would be wise to take a holistic approach to asset allocation and continue to embrace risk in portfolio construction.
Have questions? Ask us. We can help.
- Created on .


